 loading
FindingsMoney troubleEconomic insecurity, state by state. 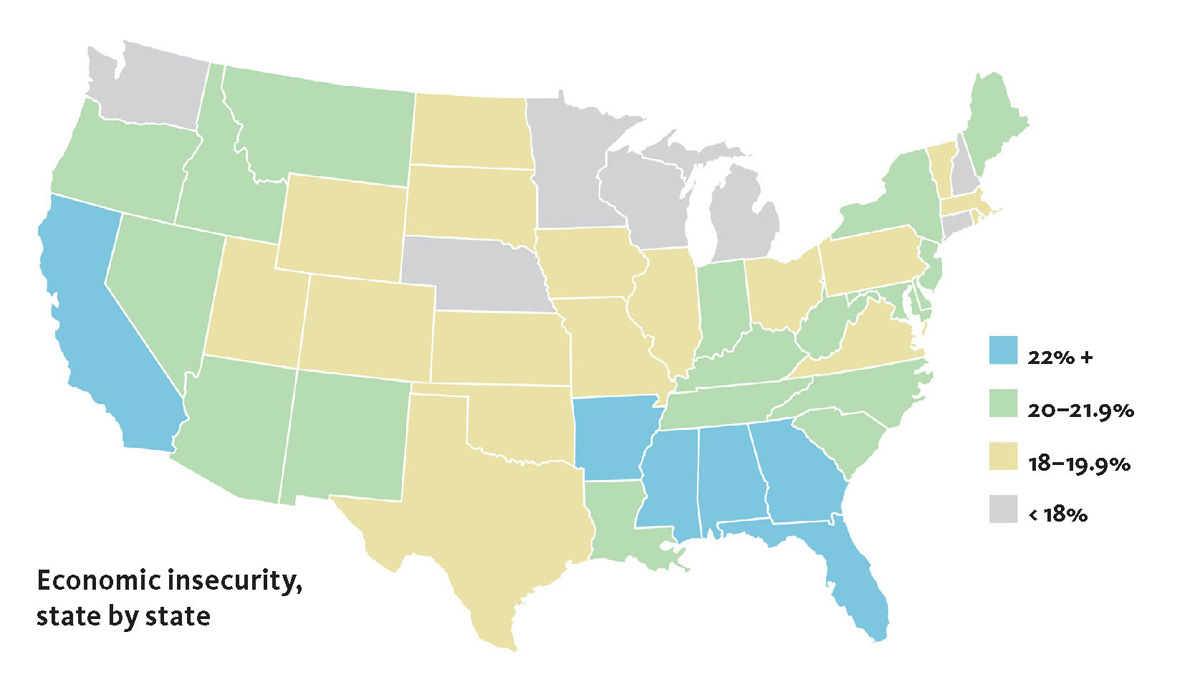 Chart: Mark Zurolo ’01MFA. Source: Economic Security Index.This map shows the percentage of households in each state that experienced at least a 25 percent loss of income during 2008–2010 (without the resources to cover it). View full imageHow many US households today are having serious economic difficulties? And which states have been hardest hit? An analysis published online in June offers some answers, and they’re not reassuring. Yale political science professor Jacob Hacker ’00PhD and his colleagues have found, as their website (economicsecurityindex.org) puts it, that “the percentage of Americans who experience a major economic loss has risen substantially over the past two decades.” In many states, more than one fifth of the households had trouble in 2010. “This is not a pretty picture,” says Hacker. “Some states have done better than others, but the long-term trend across the board is that all states have seen increases in what we call ‘economic insecurity.’ And nowhere has it really come back down.” To measure the number of households that faced serious new economic stress in any given year, Hacker and a multidisciplinary team from Yale, the Urban Institute, the Federal Reserve Bank of San Francisco, and Ohio State University developed a tool they call the Economic Security Index. The index looks at data on three risks households may face: income loss, increases in medical spending, and insufficient savings, investments, or family support to handle the first two risks. The researchers counted any household that sees a 25 percent or greater decline in income in a single year—and hasn’t got the resources to cover the loss—as a household that experienced economic insecurity. (Since the index takes only three factors into account, it’s likely it undercounts the number of troubled households.) The team has calculated, for every year from 1986 through 2010, the number of US households that took that 25 percent hit. (They used data from the US Census Bureau and Bureau of Labor Statistics, and excluded Alaska and Hawaii, due to insufficient data.) Over that period, every state saw an increase in the percentage of households under serious stress. Regionally, the Deep South fared the worst and New England the best. The three states with the largest percentage of households meeting the insecurity definition in 2010 were Mississippi (24.5 percent), Arkansas (23.6 percent), and Alabama (23.1 percent). States with the lowest percentage were Wisconsin (15.9 percent), New Hampshire (17 percent), and Connecticut (17.3 percent). Hacker says states with a large proportion of low-wage jobs and minority workers, and fewer numbers of college-educated people, are more vulnerable to increases in insecurity. States with a relatively recession-resistant base, such as high-tech or energy extraction, do better, as do states with strong unions.
The comment period has expired.
|

|
 Print
Print Email
Email